MONITORING
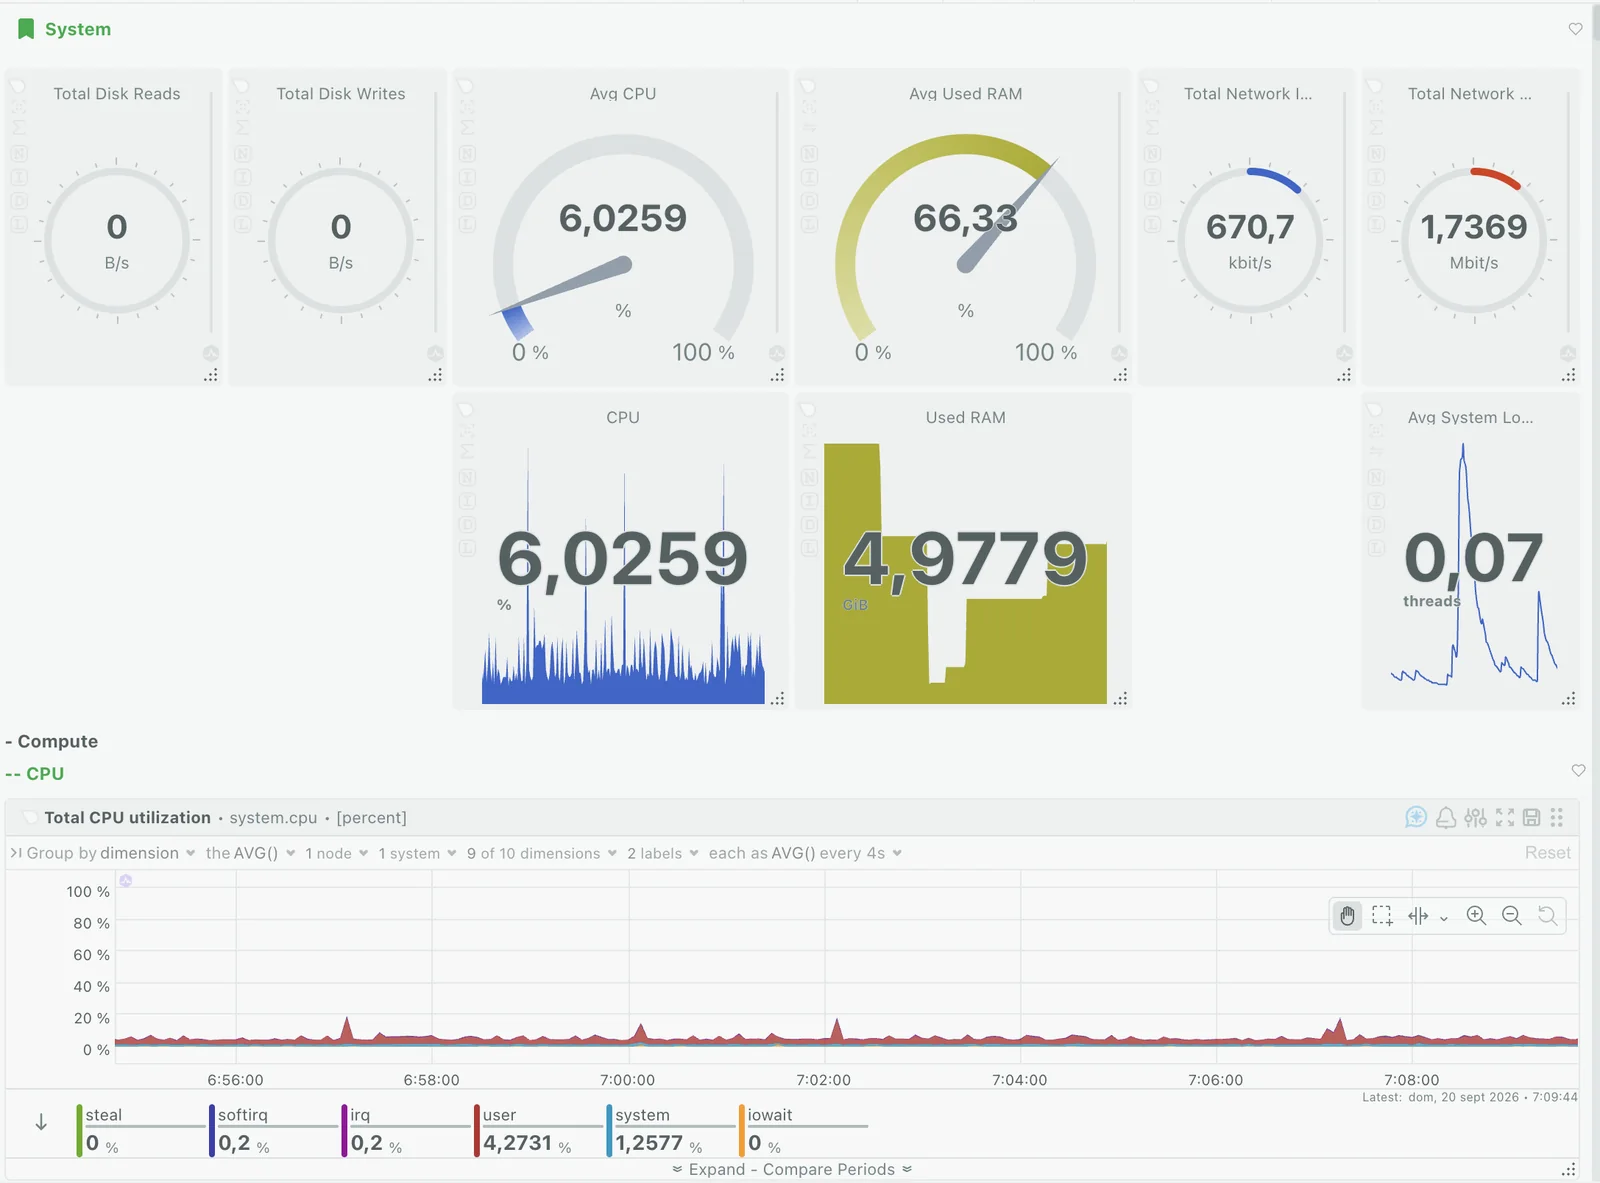
Monitoring at one-second resolution
Servers, containers, databases and applications, with per-second metrics on Netdata. Rollout, configuration and operation are handled by ADAPTIA.
THE TOOL
Why Netdata
-
One-second resolution
Every metric is recorded every second.
-
Automatic discovery
The agent finds the host services by itself: Oracle, PostgreSQL, MySQL, Nginx, Docker, Kubernetes and several hundred more.
-
Agent on the host itself
The agent runs on the machine it measures, with bounded resource use and no dedicated collection server.
THE SERVICE
What it includes
-
Rollout
Agent installation, control plane, and connection of on-premises, cloud or mixed environments.
-
Operation
ADAPTIA handles the alerts. Scope, hours of cover and response times are set in the contract.
-
Dashboards
Per-team and per-system views, with the metrics each area needs to watch.
-
Alerts
Thresholds tuned to how the system actually behaves, with notification to Slack, PagerDuty or a webhook. Each alert carries its response procedure.
WHERE IT IS USED
Typical environments
-
E-commerce
Traffic peaks during campaigns and catalogues with many concurrent visits.
-
Logistics and warehousing
WMS systems and their application and database servers.
-
Databases
Oracle, PostgreSQL and MySQL instances, with engine metrics alongside operating-system ones.
-
Containers
Docker and Kubernetes, with automatic discovery of new containers.
-
SaaS and microservices
Services spread across many processes, with latency and errors measured per service.
-
Mixed infrastructure
Physical servers, virtual machines and public clouds under a single control plane.
Let’s talk
Tell us what you need.